Remek! Market Scanner Pro (RMSP) has been an integral part of our trading toolkit for years. It allows us to track any number of markets for opportunities, regardless of the level of automation we choose in our trading. It is paramount that you spend time to understand what each column in RMSP means. Let’s see a current example of how RMSP provides quantitative, objective and actionable information to our trade desk.
Remek! Market Scanner Pro is customizable: it tracks our selected markets for trading opportunities on our defined timeframes. Let’s look at the SETUP column (which we track on a 240min timeframe): at this moment we have a SHORT setup on the 6S. Good. (Note that we can set up a sound or email alarm easily to be notified of this event, so no need to sit at the screen all day.)
Note that we have a 240min chart in the upper left corner of our trading workspace. Also note that there is a SHORT setup (as defined by our trading algorithm) on the chart, shown both by the candles (price action) and also in the form of a text message in the upper left corner: what RMSP tells us quantitatively and objectively, we can also see on our chart, concurrently, in real time. Our Market Scanner Pro and our charts are in sync.
What you do with the opportunity identified by our software (which is, simply, our methodology in code) is, of course, up to you:
- you can choose to do nothing (this can be for several valid reasons, depending on your trading plan)
- you can trade it with your selected tool:
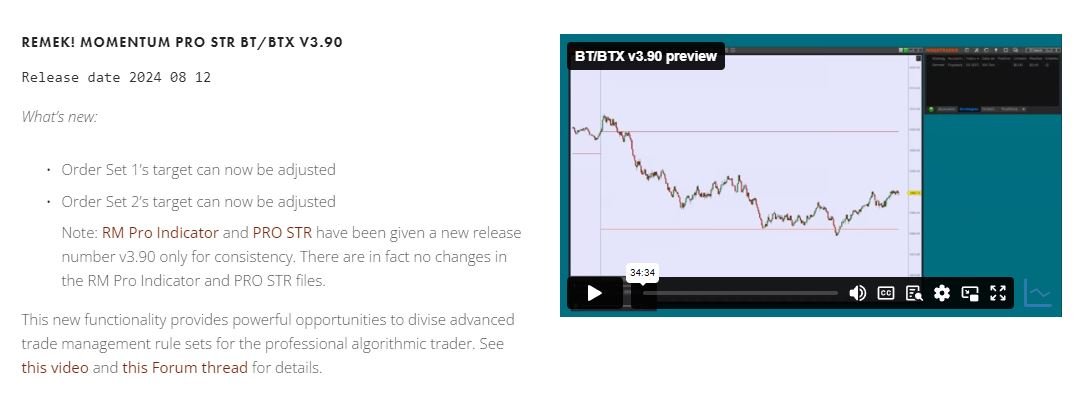
- PRO STR (if you want to trade algorithmically while retaining manual control)
- PRO STR BT (if you want to trade fully algorithmically, including with automated risk management and capital protection safeguards)
- or completely manually (although in our day and age, that is less likely to lead to
success, given that other market participants often use advanced automation in their trading)Notice what we expect to happen next (see image below) if this setup evolves into a signal (aka trigger):
a) on the close of the bar on the 240 min chart: a short trigger will appear (in the form of a red arrow), and at that same moment, the “Short Setup” message in the upper left corner will disappear.
b) the SHORT setup message in the RMSP will disappear and a SHORT message will appear in the Signal column.
Note that our complimentary Excel chart, which you can see free of charge on the right and which is updated a few times a day), is a copy of our Market Scanner Pro. Of course, the real Remek! Market Scanner Pro which you see in the lower left corner of your Remek! workspace updates in real time.
After all the above, your trivia questions of the day:
- which instrument in our RMSP above requires the largest account and the smallest account size to trade? One of the columns will tell you the answer.
- where is the YM right now on the daily chart compared to the Keltner? (one of the columns has the answer)
- which instrument is currently in a long hotzone, a state that often preceeds the Setup phase (which then may lead to a Signal). Notice how our trading process is similar to a manufacturing process in a factory or a triage process in a hospital! A good trading process is nothing but a well-designed and monitored process, and our process has served us just fine over the years.Questions, comments? Let us know if you find the above concepts helpful to your own trading! And do not forget to visit our shop to empower your own trade desk if you haven’t yet!