Full disclosure: the information in this post can be life-changing.
We trade crowd behaviour. Or, to be precise, a certain aspect of it. Now many aspects of crowd behaviour can be datamined, and, true, if you look long enough, dig deep enough, you’ll find something. But the way datamining works, the deeper you have to dig, the higher the chance that what you find is a fluke aka random, meaningless accident with no edge.
Which we found out about 15 years ago, as most traders do, the hard way. So what we have set out to do over the years since has been to capture not just any aspect of crowd behaviour, but one that is enduring, one that is grounded in solid theory, one that is so deeply rooted in human psychology that is not likely to change any time soon, and one which is evidenced in the data.
And evidenced in the data it is, almost daily. And we call it the re-emergence of momentum out of consolidation areas. Here’s today’s:
Internalize the anatomy of a 1R trade
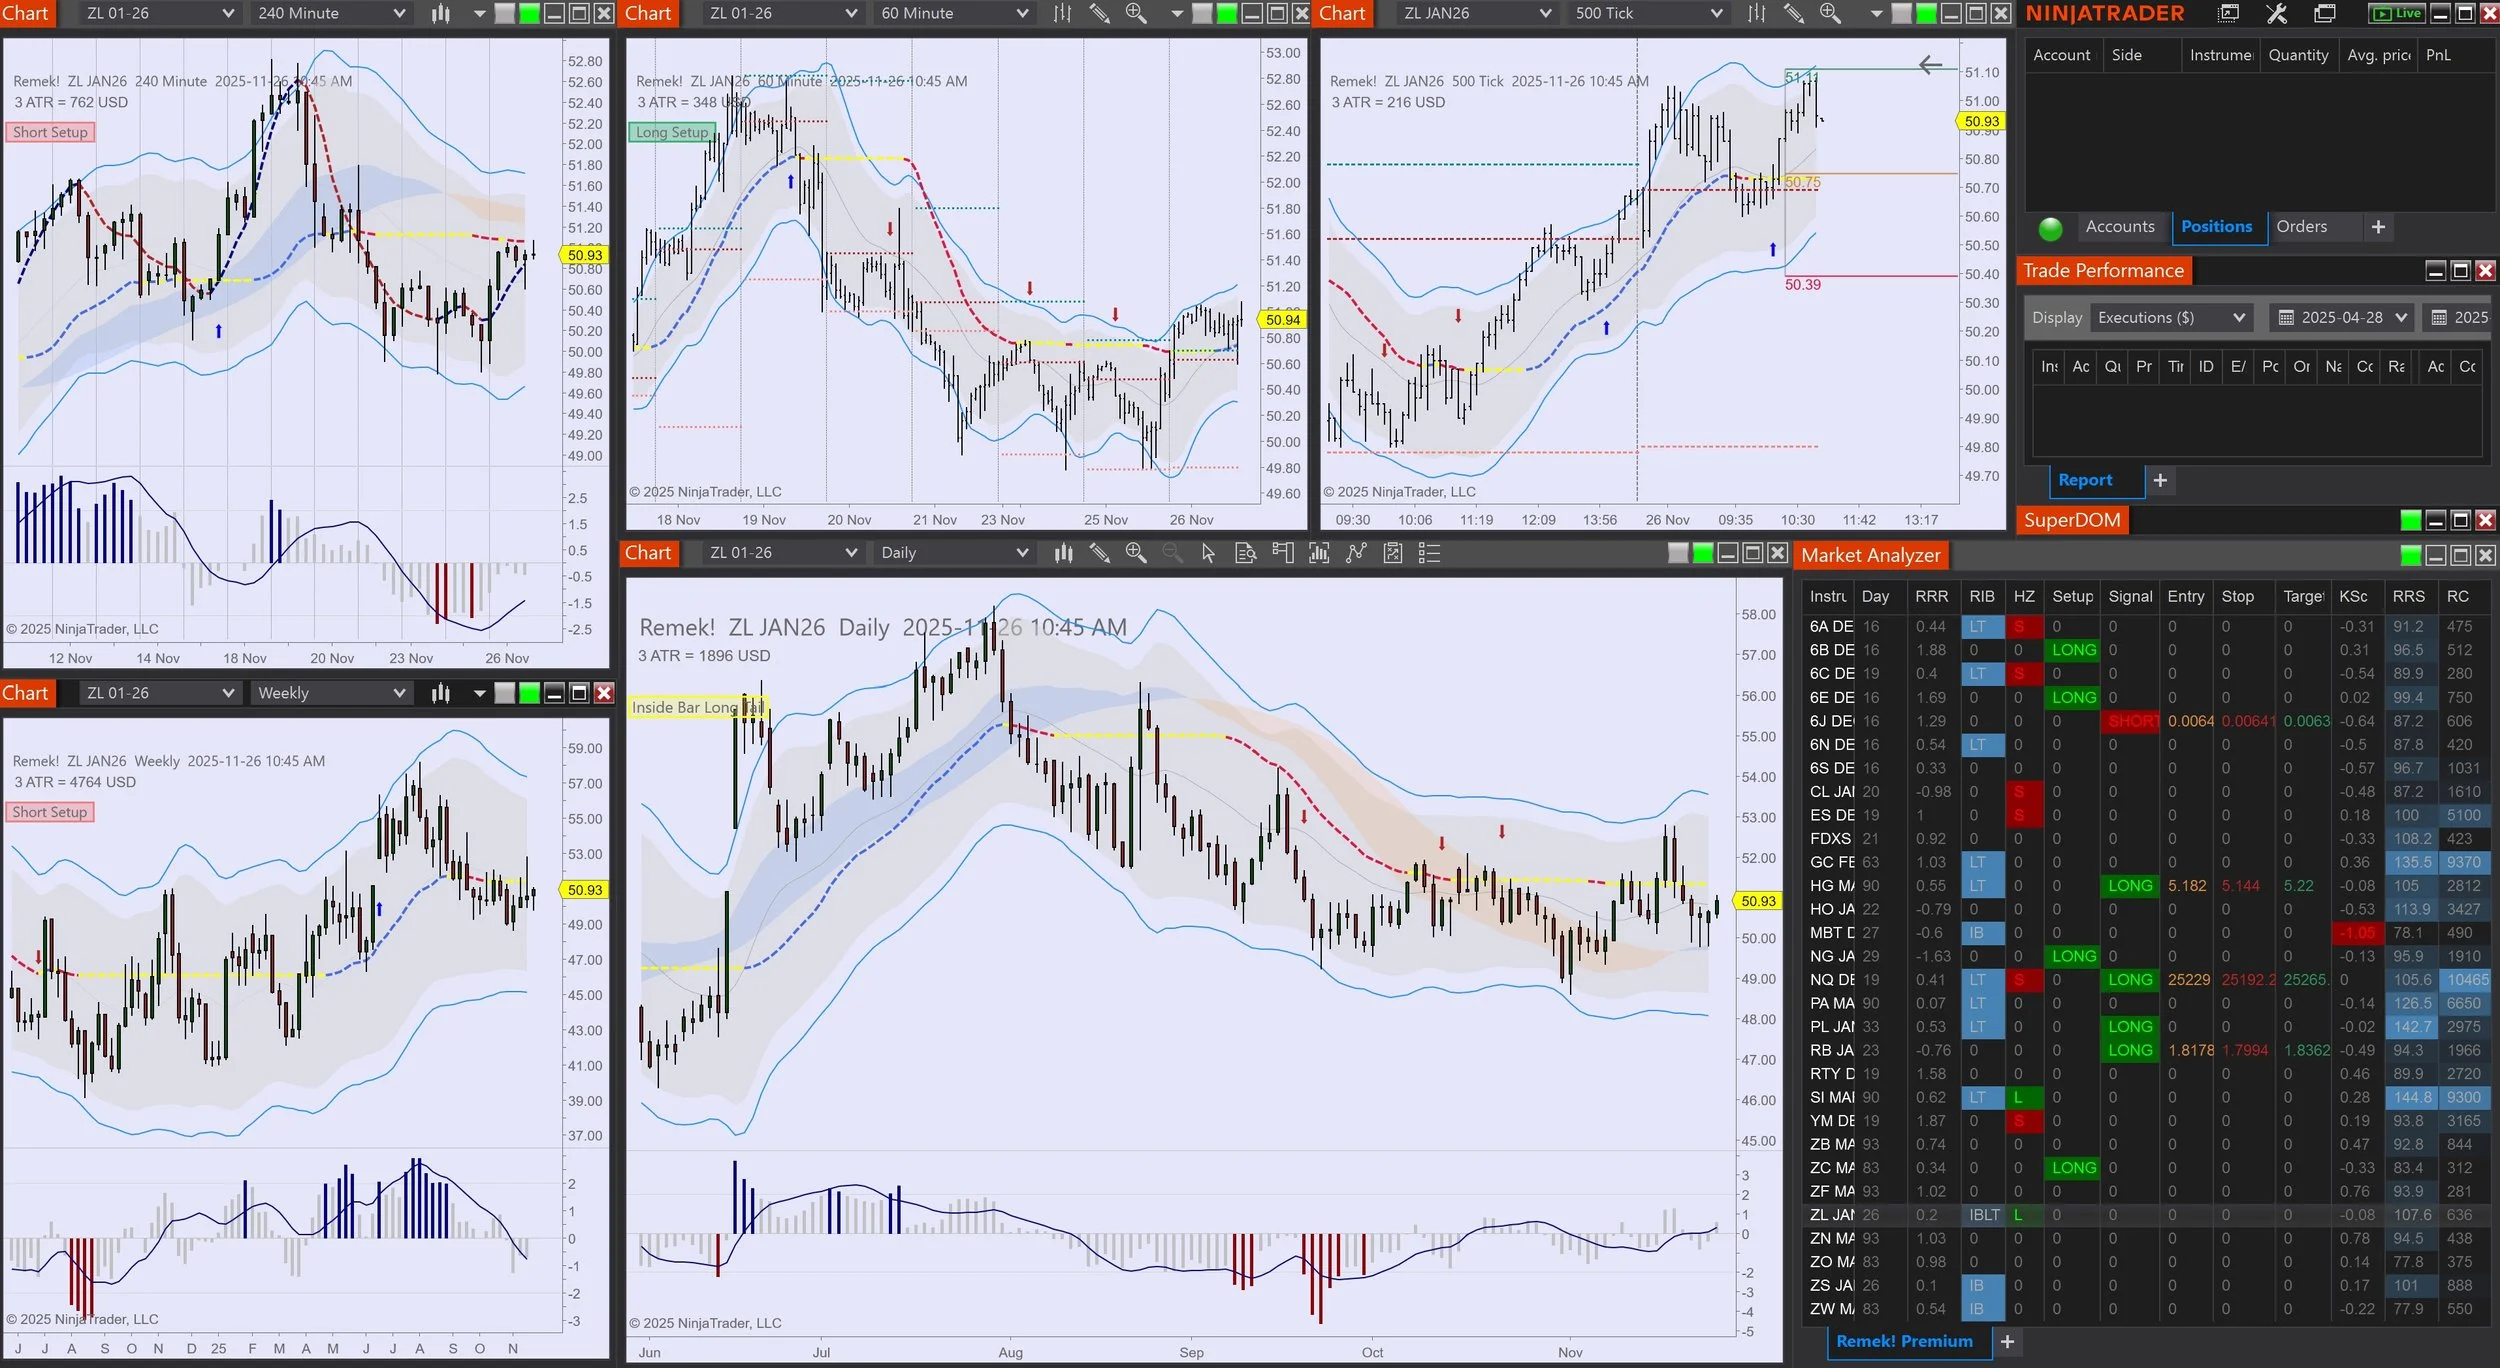
The story starts yesterday, with the setup, when our Market Scanner Pro and our PRO STR BT identify a solid long setup on ZC. As always, our Premium subscribers are the first to know. (And they also know that they can either pursue this opportunity on the futures market (ZC) or with the appropriate ETF (CORN). Note the trigger and the time stamp on the 240min chart: 9.17pm EST. We’ve got work to do!
2. Four things can happen when we take a trade like this:
a) the trade fails, we get stopped out with a 1R loss or less (depending on how our software manages the trade for us). When this happens (about 25% of the time), we remind ourselves: a losing trade is a cost of doing business.
b) the move loses momentum and price action turns sideways (about 25-30% of the time). These situations are best left to be handled by our PRO STR BT algorithm (often for a <1R win or a slight, mosquito-bite-size loss).
c) the trade works just fine (the rest of the time): price hits 1R, and depending on our settings, we are either out, or keeping a runner (which is the case in this ZC trade, given the potential on the daily).
d) simple consolidation evolves into a complex consolidation, often resulting in a strong move in the original direction
Now, if you look at the daily chart, you’ll see the party is just starting, so we expect to stay engaged. In the meantime, Remek! Premium subscribers and other seasoned Remek! traders are not blind to what is happening on soyabeans, which has also triggered (see below). Do note both ZC’s and ZS’s favourable volatility-based risk profile (RC column below)!
If you like the above, consider deploying our software and becoming a Premium member today!