May 2022: Remek! Indicators Month!
Can I trade this instrument at this time on this timeframe with my account size within my pre-defined risk parameters? Yes or no?
We as traders are faced with that question every day. If you want to know the answer, read on!
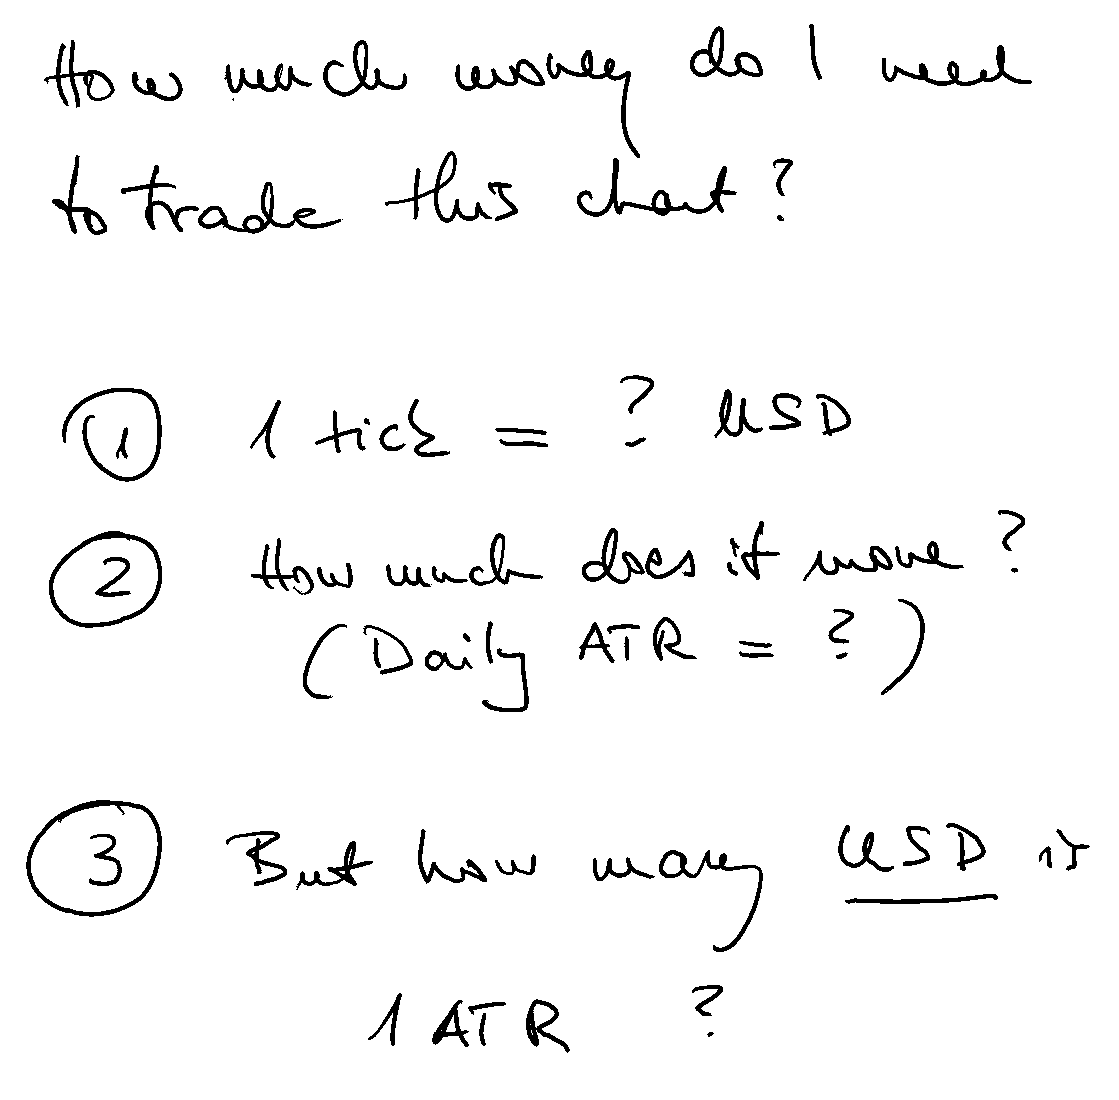
So you’re looking at NQ and see that one tick is 5 USD, then you look at GC and see that one tick is 10 USD. On to ZB to see one tick is 31.50 USD. It seems obvious to think that the least risky out of these for a given account size is to trade NQ, and the most risky is the ZB, right? Wrong! (as many unsuspecting traders who tried can attest). Tick size in itself is not an indicator of risk. So what is? And more generally, how can I know if I have enough money to trade an instrument on a given timeframe at any one time? And how do I measure “risk” anyway?
First off, tick size expressed in USD, one way or the other, will obviously be one of the inputs into the equation that can answer the above questions. But what else? And how can I easily calculate it?
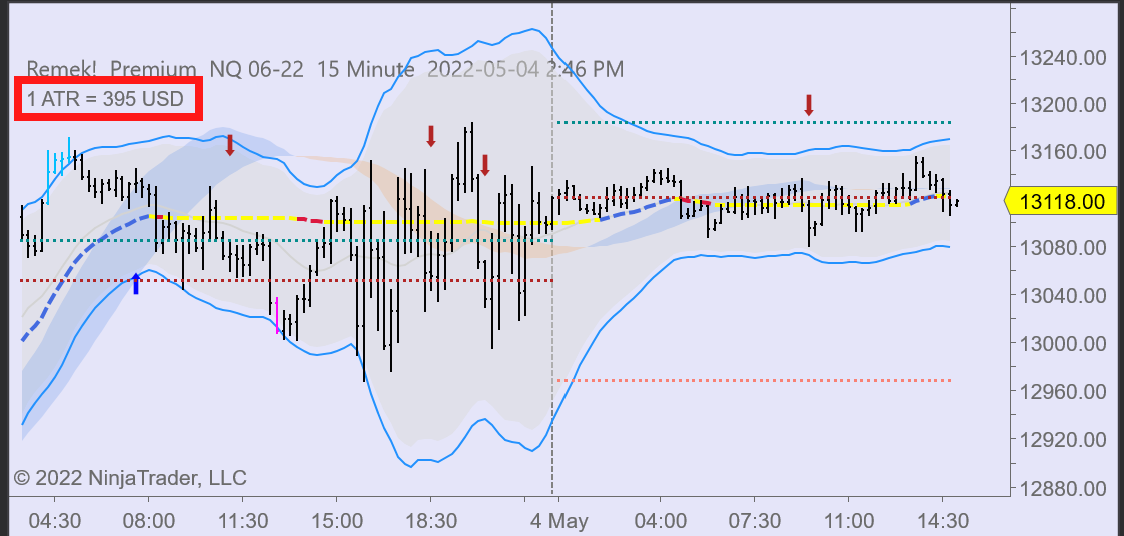
Volatility. I’ll need to put my stop somewhere after all. And where that ‘somewhere’ will be will depend very much on volatility. How can I measure volatility? Is 10 ticks high volatility? Is 50? No way to know. I need a measurement unit that is normalized, i.e. that works the same way on any instrument. Standard deviation could be one, ATR (the average candle size over a given lookback period) another. In this example, we’ll use ATR (note: in Remek! Converter you’ll have a choice). So instead of saying “my stop is 20 ticks from my entry”, which may make sense on one instrument but little sense on another, we’ll say “I’ll put my stop x ATRs from my entry, which will make sense - since it’s a normalized value - on any instrument. (You can use x=3 for starters).
Then I’ll have to realize that there’s no guarantee that a given volatility reading remains the same over time. If the average daily candle on the ES was 20 ticks two months or two days ago, why should it be the same now? Volatility changes over time.
Think of two monkeys on a trampoline. Maybe one is a little heavier (let’s call that one ZB), but doesn’t jump too high. The other might be a little lighter (we’ll call that one NQ), but jumps much higher than ZB. One way or the other we need to include ‘volatility’ in the math!
Then there’s the “when”. On average, our ZB monkey may be a little lazier, but still, there may be days when suddenly it will start jumping like a gazella. Unusual? Perhaps. Possible? Definitely! By the same token, our monkey called NQ may also have quieter days when it hardly jumps at all (like on a pre-FED-day like yesterday).
So you see, the “weight of the monkey” (the tick value in USD) is only one of the inputs in the math. The “current time” will be another.
And there’s another question: say, I have a 20,000 USD account. I’m a smart, disciplined trader so I have a rule never to risk more than 2% of my account size at any one time (and I’m only in one trade at any one time). So that means my maximum stop is 400 USD. Can I trade the 10 minute NQ chart today? While you can put the equation in Excel and keep it in the corner of your screen as you trade, or you could do the math in your head, both would be unneccessary distractions in the heat of the battle.
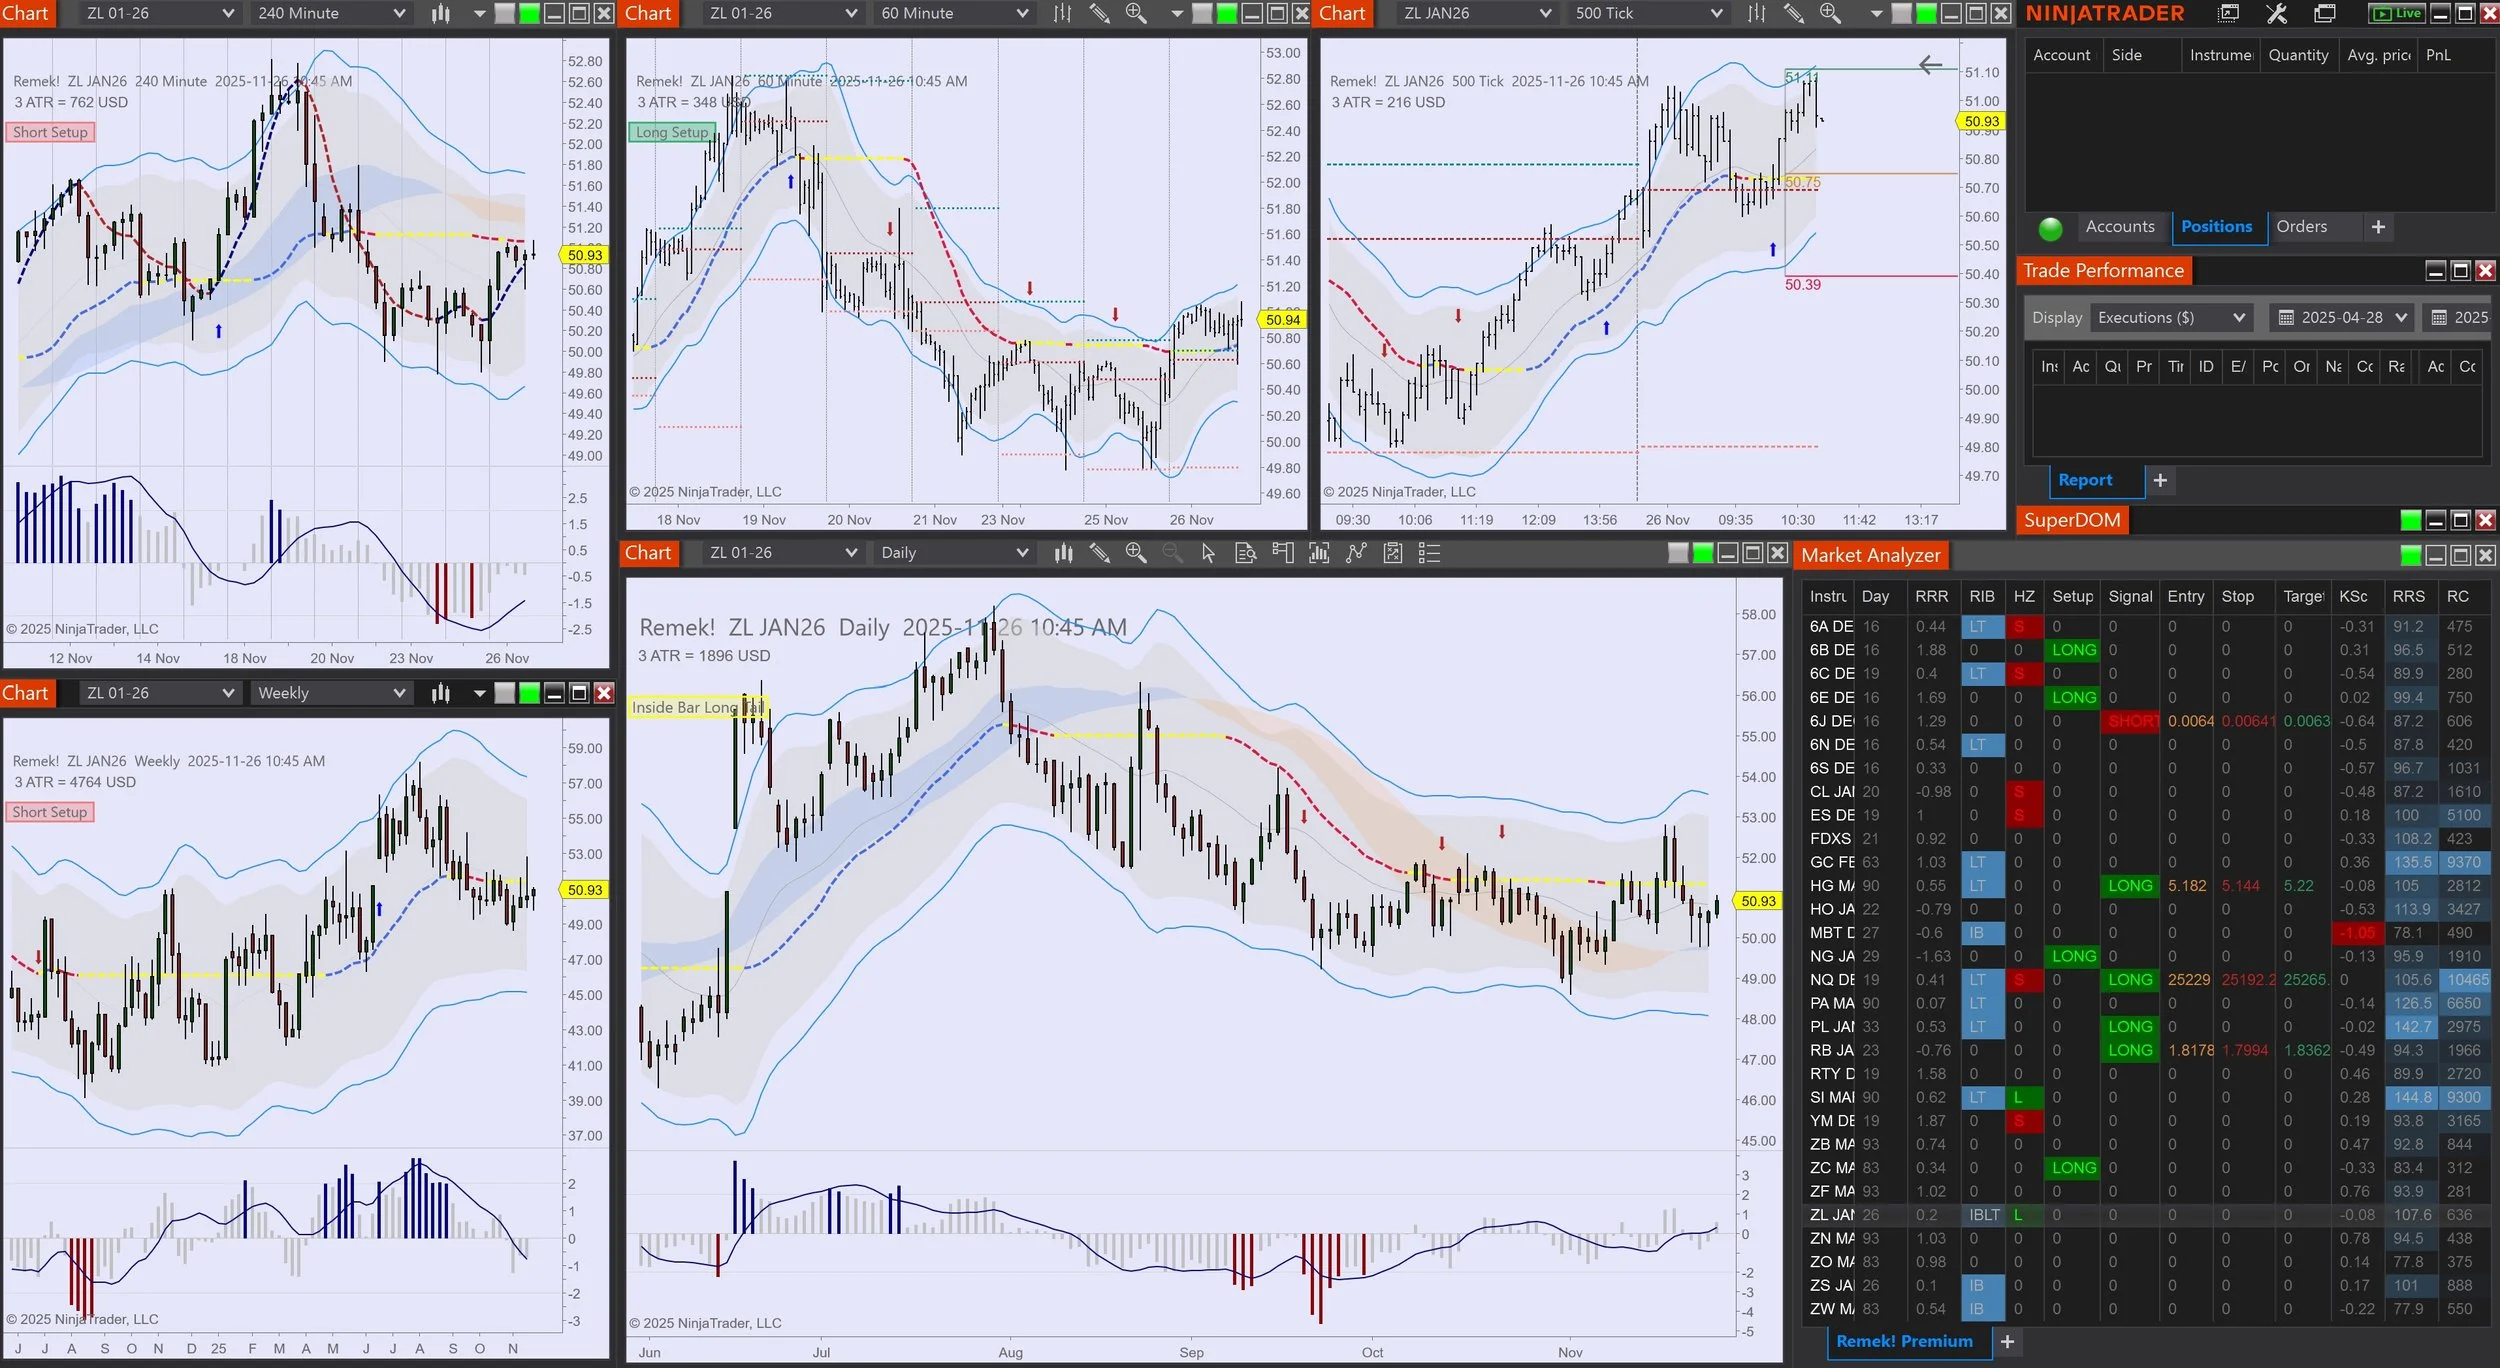
The good new is: no need to be distracted: Remek! Converter will do the math for you in real time, on each incoming tick if you so want. With Remek! Converter on your chart, you will always know the answer to the question:
Can I trade this instrument at this time on this timeframe with my account size within my pre-defined risk parameters? Yes or no?
Get Remek! Converter to answer that question (and much more) in real time, by using the code REMEKCONVERTER2022 at 25% OFF, for a limited time only.
We’d like to thank all early adopters who voted for our work by taking advantage of introductory discounts in the past. Early adopter discounts are being phased out. Going forward, 25% OFF is the deal. Grab your license today!
Mindful trading out there!


